With government issued statistics and charts on COVID-19 having been a semi-regular feature of prime-time television viewing over the last year, the need to effectively communicate risk levels and uncertainty has been more important than ever.
In fact, uncertainty, specifically Government decision making in uncertainty, is the topic of the upcoming webinar which GAD will be presenting as part of the Analysis in Government month.
In 2020 a toolkit was developed by a cross-departmental team for Assessing and Communicating Uncertainty. This is targeted at all government analysts and is available at Uncertainty Toolkit for Analysts in Government.
The aim is to assist analysts in providing decision makers with data in such a way that the inherent uncertainty of the given situation is understood. This should help to ensure that fully informed decisions are made.
However, the toolkit could also be applied to the work of government analysts who are at the forefront of providing data for the general public. The desired result will be for the public to gain a better understanding of the risks faced with regard to the COVID-19 pandemic.

The nature of risk
When quantifying risk it is important to consider 2 parameters. One to measure the magnitude of the risk, and another to measure its likelihood.
It is uncontroversial to assert that in order to understand risk, one must understand both the level of uncertainty involved and the potential magnitude of that risk.
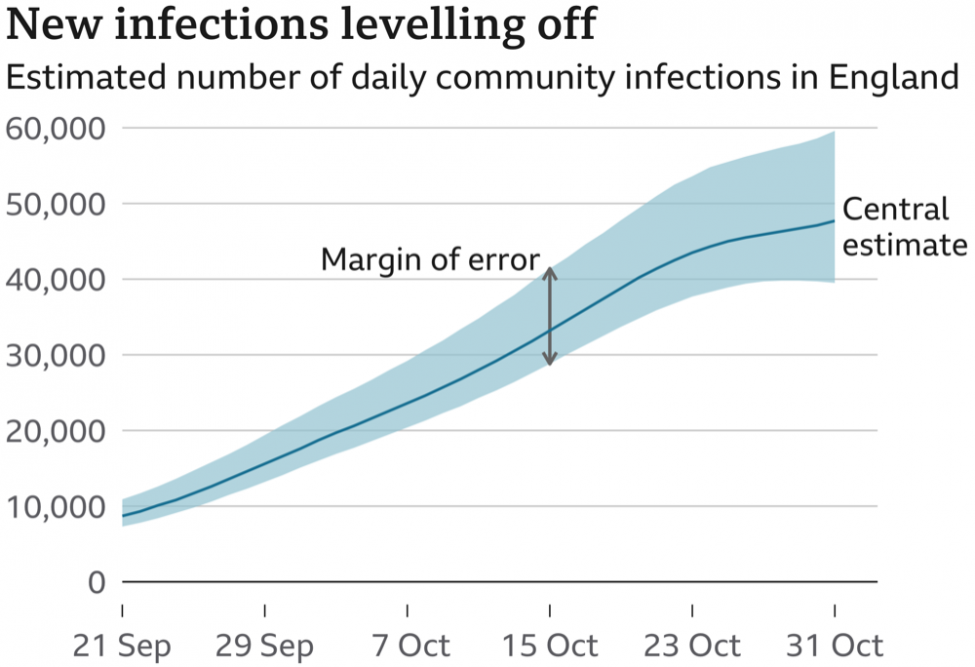
The chart below, ‘New infections levelling off’ was originally from the Office for National Statistics (ONS) and was on the BBC in November 2020. It shows the magnitude of the risk faced and includes a measure of uncertainty.
This is but one example of where a simple technique, such as including a margin of error, can greatly improve the information being conveyed by a chart. In doing so, it can improve the audience’s understanding of the underlying risk.
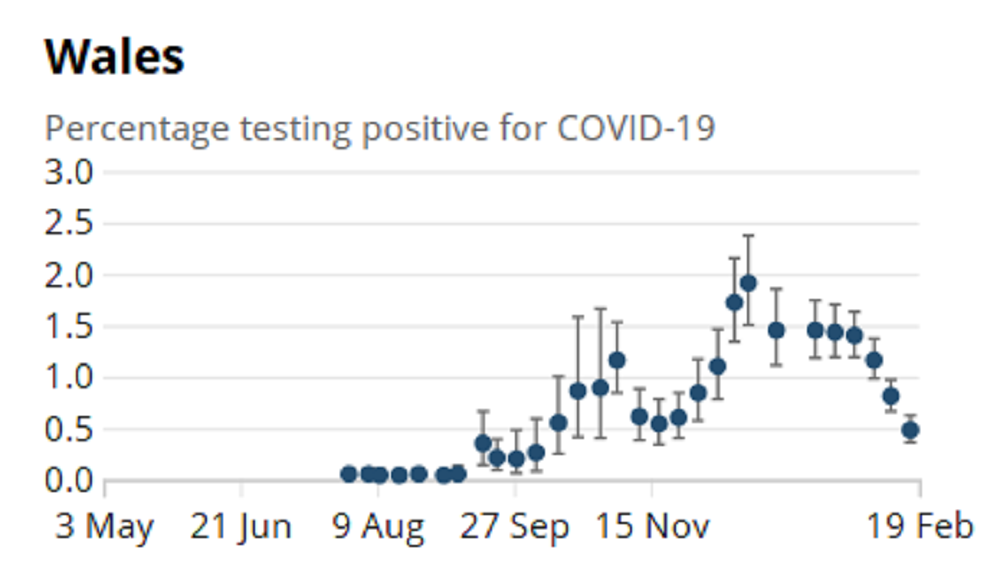
Although it may be natural to assume that projections into the future are inherently uncertain, it may be less obvious that recently gathered data will also be laden with uncertainty.
The chart below (Wales, Percentage testing positive for COVID-19) employs error bars in a way that shows the uncertainty of the data itself.
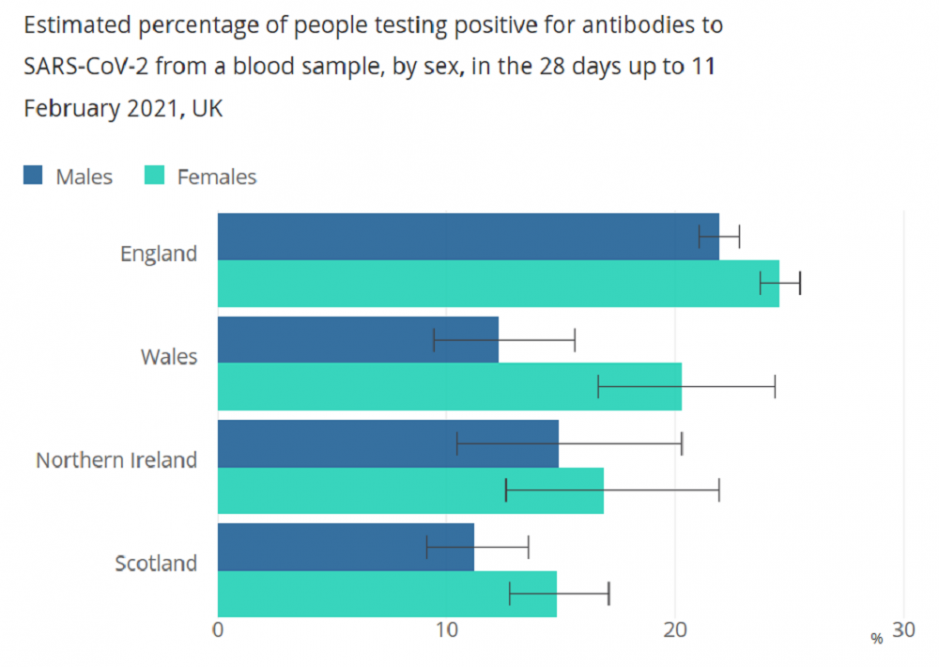
A further example of recent reporting where careful consideration has been given to the communication of uncertainty is contained in the Coronavirus (COVID-19) Infection Survey antibody data for the UK: 2 March 2021.
Here, error bars are included on every chart, and a clear explanation of the meaning of these bars is offered: “Black lines represent 95% credible intervals around the estimates, which reflect a 95% probability that the true value lies within the ranges shown.”
What is the toolkit?
The Assessing and Communicating Uncertainty Toolkit is a new guide for analysts working in government to use when confronted by a problem that includes elements of uncertainty.
The toolkit breaks down the process of conducting analysis involving uncertainty into a 4-step process:
- agreeing how uncertainty should be used to help answer the question
- defining and identifying uncertainty
- measuring and understanding uncertainty
- presenting and communicating uncertainty
For each step the toolkit guides the analyst with examples and explanations, providing key points to consider and suggestions of actions to take. It also includes several case studies so the analyst can see the whole cycle in context from start to finish.
Why does this matter?
As we saw during 2020, the government’s actions to mitigate the risks due to the COVID-19 pandemic have had a profound effect on our daily lives.
It’s important that data prepared for decision makers in government is presented in a way as to ensure that the nature of the uncertainty and subsequent results are fully understood.
It’s also vitally important that the data being presented to people allows them to understand the level of uncertainty inherent in the results. The Assessing and Communicating Uncertainty Toolkit helps analysts to do this, and in doing so is designed to ensure that properly informed decisions can be made by all.
The Communicating Uncertainty Team
The toolkit has been a collaborative effort by representatives from a wide range of government departments. It represents evidence and best practice from across the analytical community within and outside of government.
The current iteration of the toolkit is the result of extensive research and discussions surrounding good practice for dealing with and communicating uncertainty. This work is carried out by analysts working on the front line in the field of presenting technical analysis to decision-makers.
Phase 2 of the project, which is well underway, is to engage more widely with academics and to learn from even more published papers in this field. This will help the team ensure the advice being offered reflects the latest findings of academic researchers and make sure all relevant considerations have been taken into account, with the goal of making the toolkit more robust.
Actuaries are experts at risk and uncertainty, so the Government Actuary’s Department has naturally been a key contributor to the toolkit. It’s been a privilege to work with colleagues from a range of government departments and organisations that have contributed to the production of the toolkit.
Further information
To see (and use) the toolkit for yourself, please go to: Uncertainty Toolkit for Analysts in Government.
As part of Analysis in Government month in May, people in GAD will deliver a webinar on 12 May called Government decision making in uncertainty.
Disclaimers:
A version of this blog was originally published by the Whitehall and Industry Group on 17 March 2021. The opinions in this blog post are not intended to provide specific advice. For our full disclaimer, please see the About this blog page.
2 comments
Comment by Mike Clark posted on
Interesting to see, thank you. A question to GAD:
I like to separate uncertainty from risk. When we specify ranges (as in cases above) are we assuming we know the underlying probability distribution?
What about true uncertainty, where we are close to not having much of a clue about the underlying data from which our sample is taken? Or have I misunderstood (quite possible!). Thank you.
Comment by Miriam Singh posted on
In many of the ONS examples a measure of the mean is being presented which is based on a sample of data. In such cases the Central Limit Theorem can be applied to enable the calculation of error bars around estimates of the mean, without needing to know the underlying probability distribution. But there may be situations where this is not appropriate, for example, if the sample is too small or has not been randomly selected. Also, care needs to be taken if the underlying distribution is heavily skewed or there are other real-world factors effecting the data. In these cases further thought might be needed to help explain the ‘true’ uncertainty. We often find scenario analysis helpful.
We certainly agree with the idea of considering uncertainty and risk separately. Often when people talk about risk, they are interested in measuring the behaviour in the tails of the distribution (eg the 1 in 20 chance of an event occurring). To do this we often have to make an assumption about the underlying distribution! One option we often find helpful is to take a collection of common distributions, with a variety of shapes, and apply a series of goodness of fit tests to identify which distribution best fits the data.