Workforce planners and people analysts at smaller government bodies may know the feeling … A senior colleague asks an urgent question: what will the organisation’s headcount look like in 3 years’ time? How can we manage headcount restrictions? What’s the impact of spending more in team X? You have a spreadsheet, some assumptions, an understanding of the importance of the answer, but no quick, or robust, way to get there.
The consequences of getting things wrong are real: A spending review submission based on unreliable headcount assumptions; a restructure that looks sensible on paper but leaves critical skills gaps a year or two later; an independent review that recommends the workforce plan has more analytical evidence. These are the kind of challenges that lead organisations to seek support from GAD.
We have been helping small government organisations tackle these questions with a workforce projection tool, developed to visualise the future shape of their workforce.
Bridging the gap
GAD recently worked with a government body that wanted better analytical foundations for its internal workforce planning. They had data and they had strategic questions, but no structured way to bridge these to develop a coherent forward view.
Working with their workforce planning team, we developed an Excel-based model that provides the analytical grounding they were missing.
The model is now being used in steering meetings with senior leadership to understand impact of current and future workforce decisions.
How the tool works
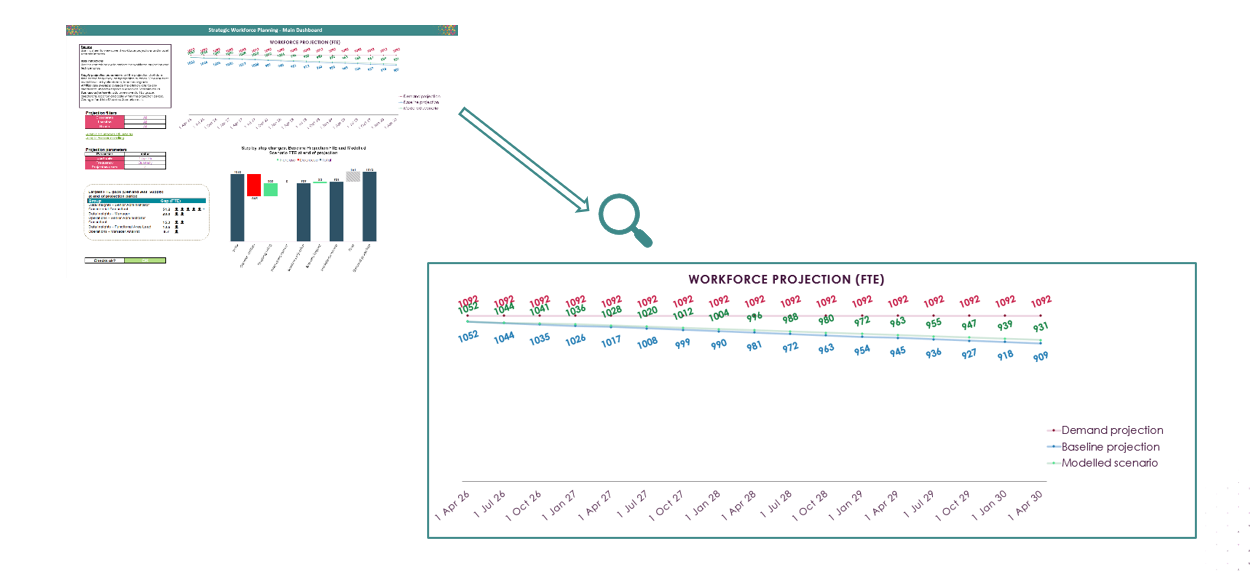
The model takes an organisation's current workforce data and projects it forward by applying rates of staff movement, such as, for example, attrition, hiring, and internal transfers between teams. This produces a baseline supply projection.
That supply baseline is then set alongside a demand projection, giving an affordability-based view of the number of roles the organisation is targeting.
The difference between the two is the gap projection, identification of where resource pressures are likely to emerge, and equally importantly, when.
The main dashboard brings these elements together illustrating answers to the questions that matter most to senior leaders and planners:
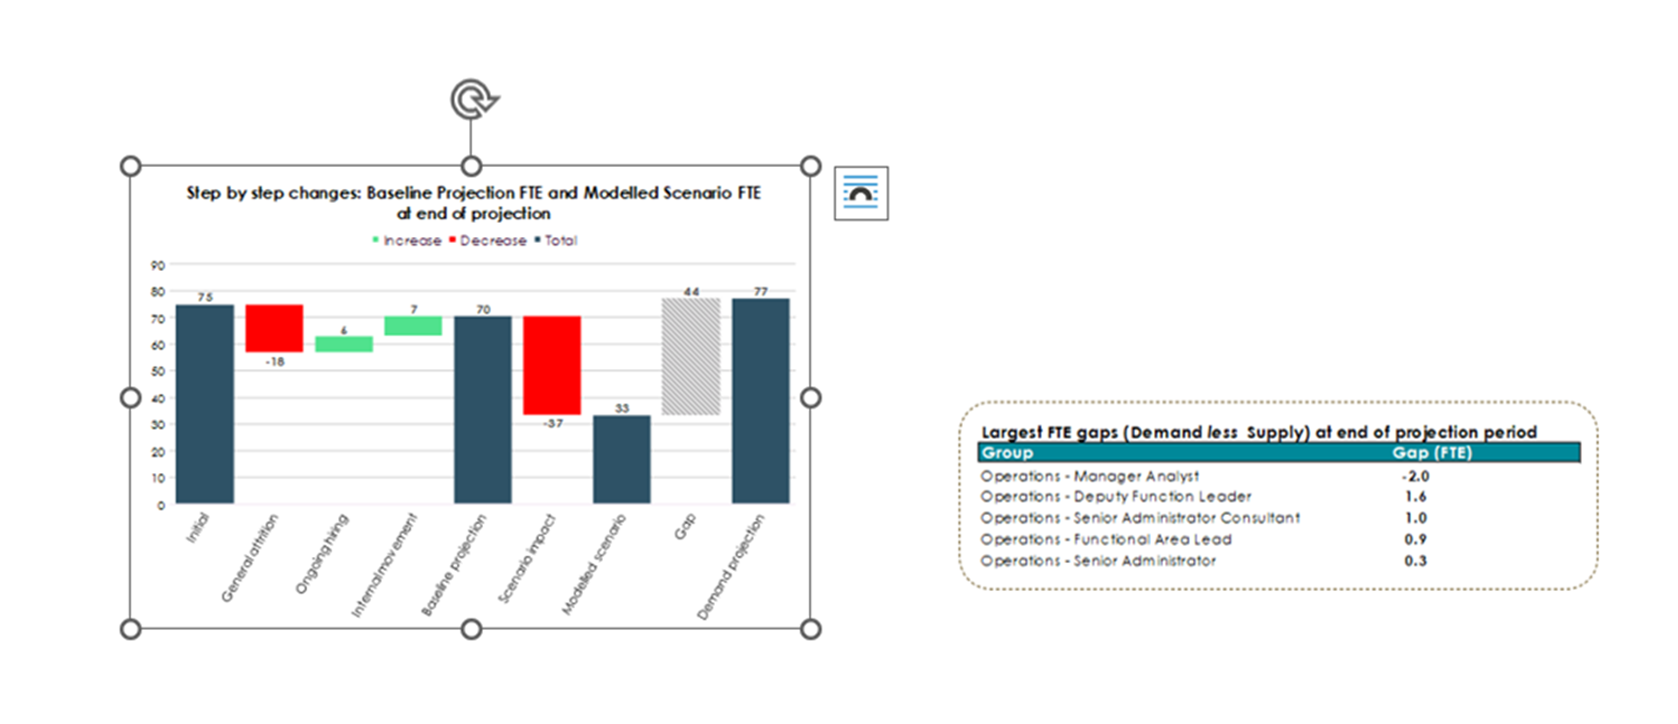
- What are our biggest supply and demand gaps and when do they bite? A ranked view of sub-groups facing the largest projected shortfalls.
- What is driving headcount change? A waterfall chart decomposing the reasons for movement from the baseline projection.
- What does this cost? Salary cost and headcount projections on a secondary dashboard.
- How does this look across the organisation? Filters to drill down by directorate, grade or location, across a horizon of up to 5 years.
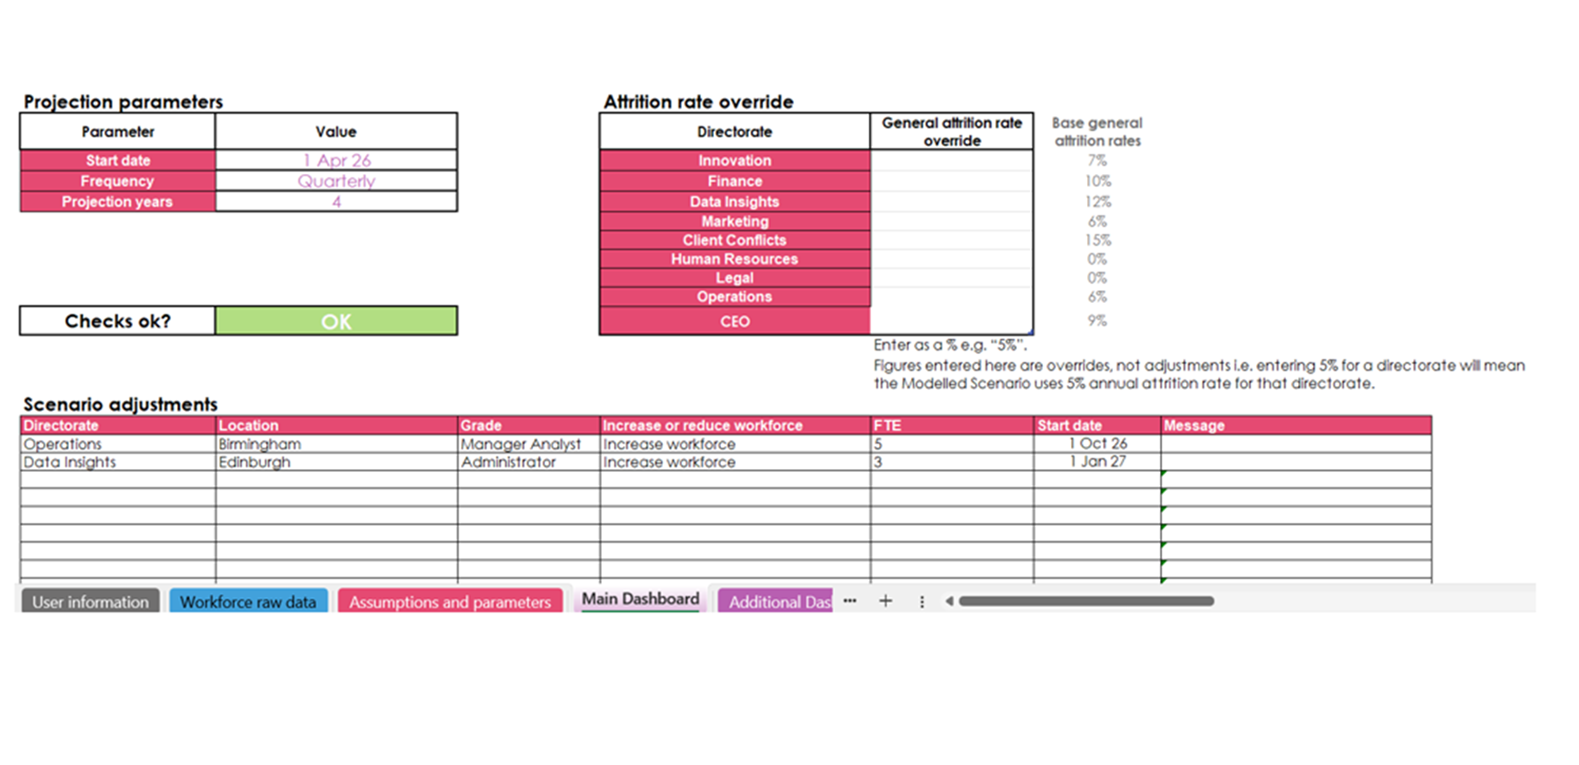
Users can also build bespoke scenarios, modelling the workforce impact of strategic decisions such as a restructuring, a recruitment drive, or a change in attrition rates in a particular team.
Confidence in professional standards
All organisations face scrutiny of their workforce planning, whether from senior leadership, or auditors. This means that the model’s foundations matter as much as its outputs.
GAD have developed the model in line with the government's Aqua Book guidance for analytical models and the actuarial profession’s standards. Its outputs directly address 3 of the NAO's workforce planning audit criteria: future demand, future supply, and gap analysis. The model’s robust structure, in-built checking, and clear documentation and governance mean that when a senior leader or auditor asks how a number was arrived at there is a clear, explainable answer.
Input data requirements
Organisations using the tool will need details of employees (in an Excel / CSV format) containing information on grade, location, team, or other relevant sub-group level information . The tool uses average salary levels rather than individual salary data, which simplifies data handling and reduces information governance requirements.
Other key inputs are informed assumptions: expected rates of attrition and hiring, typical rates of internal movements and salary budget information for the demand projection.
The combination of good data and considered assumptions is where real value is revealed. The tool provides the structure; the insight comes from the conversations the analysis enables.
Who is this for?
The tool is most naturally suited to small and medium-sized public sector bodies planning across a number of sub-groups, e.g. different teams, grades or locations, and a planning horizon of 2 to 5 years.
We would be very happy to have a conversation with you if your organisation is grappling with any of the following:
- You have workforce data but no structured process to project it forward
- You are preparing a spending review submission or business case that requires a credible, auditable headcount and cost trajectory
- You want to test the workforce implications of strategic decisions before committing to them
- You are facing efficiency targets but have no clear view of where natural attrition creates headroom versus where interventions may be required
- You are concerned about succession risk, a concentration of experience at senior grades or an ageing workforce approaching retirement
- You are considering changes to pay, grading or location policy and want to understand the combined impact
Get in touch
If you'd like to find out more or arrange a conversation, please get in touch:
Jo Howlett – joanna.howlett@gad.gov.uk
Aaron Stewart – aaron.stewart@gad.gov.uk
Disclaimer
The views expressed are the author’s own and the opinions in this blog post are not intended to provide specific advice. For our full disclaimer, please see the About this blog page.
Recent Comments