The yield (interest rates) on a bond is essentially the return that an investor will achieve if they purchase a bond and hold it until maturity. For a yield curve to be constructed correctly we only consider the bonds from a group of similar bonds, this means only bonds from the same risk class or with the similar level of liquidity. Hence the yield curve shows how the return on bonds varies over different periods into the future. The gradient of the yield curve gives an indication of forthcoming interest rate changes and economic movement.
Generally, one might expect the yield curve to be upward sloping because investors require higher returns for longer dated bonds. This is to compensate them for the higher risk of inflation and the lower liquidity involved with committing funds for longer times.
However, sometimes this theory breaks down and the yield curve observed in the market is downward sloping; this is referred to as an inverted yield curve and is shown in the diagrams below:
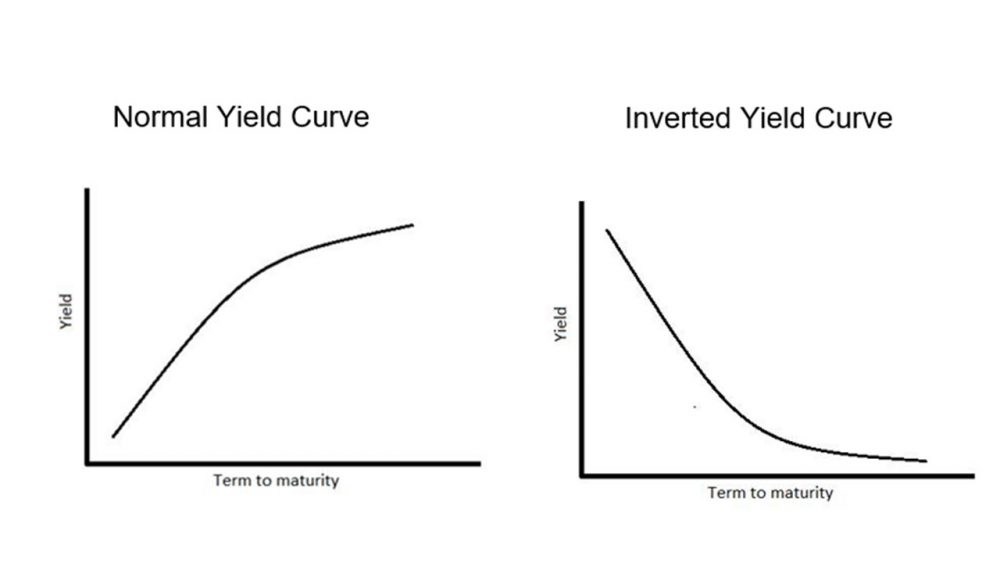
An inverted yield curve represents the situation where short- term bonds have higher yields than long-term bonds. In other words, short term interest-rates are higher than long-term interest rates.
What does this mean?
Historically, inverted yield curves have been considered as a predictor for worsening economic situations. Indeed inverted yield curves have accurately predicted recessions in the past.
There can be two drivers of the yield inversion: one at the short end of the curve (reflecting short term expectations) and one at the long end of the curve (reflecting longer term expectations).
In the shorter term, if people have expectations of economic conditions worsening, then short-term bonds may be perceived as having higher risk primarily because default risk increases in periods with worse economic conditions. Hence, investors will require higher yields on short term bonds as compensation for this additional risk.
Over the long end of the curve, risk averse investors may not be confident in other assets and hence demand long-term bonds due to the lower perceived risk. The increase in demand for long term bonds results in a fall in the yields on these bonds.
Measuring the inversion
One way of assessing the extent to which the yield curve is inverted is by looking at the difference between yields at the short and long end. For example, the chart below shows JP Morgan’s analysis of the U.S. yield curve steepness, identifying the different dates of inversion before previous recessions. The yield curve steepness looks at the difference between the 10-year bond yields and the 1- or 2-year bond yields.
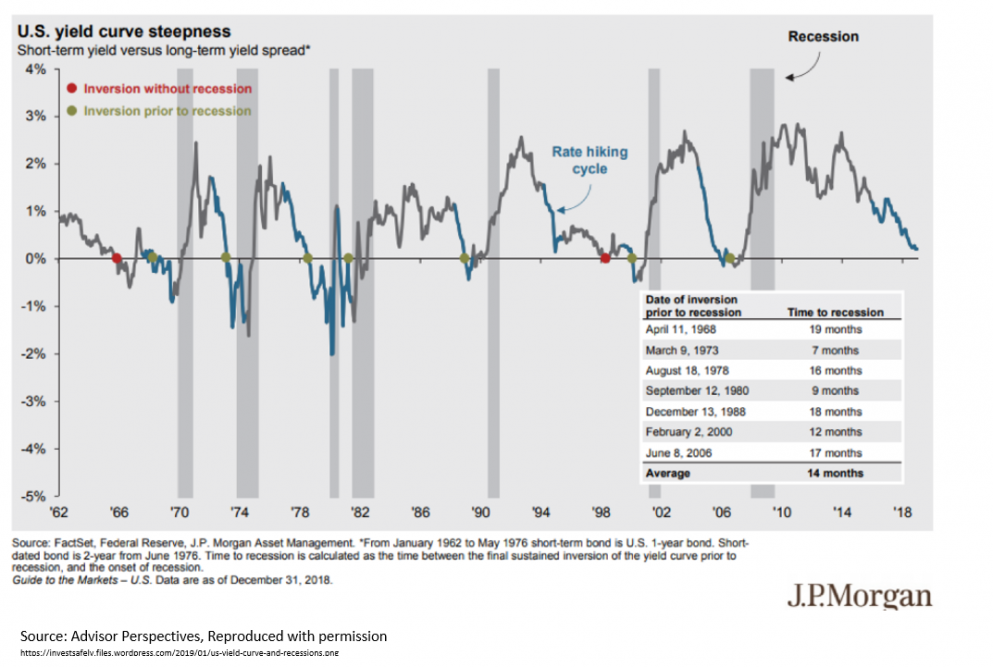
Yield curve inversions have been consistent recession indicators for US recessions since 1950. This is especially the case when we are looking specifically at the inversion when 10-year bond yields fall under 2-year bond yields which results in the yield curve sloping onward from the 3-month bond to the 10-year bond.
Historically, the yield curve in the UK has also inverted before previous recessions – as shown in the chart below which shown similar analysis as above but based on UK gilts yields.
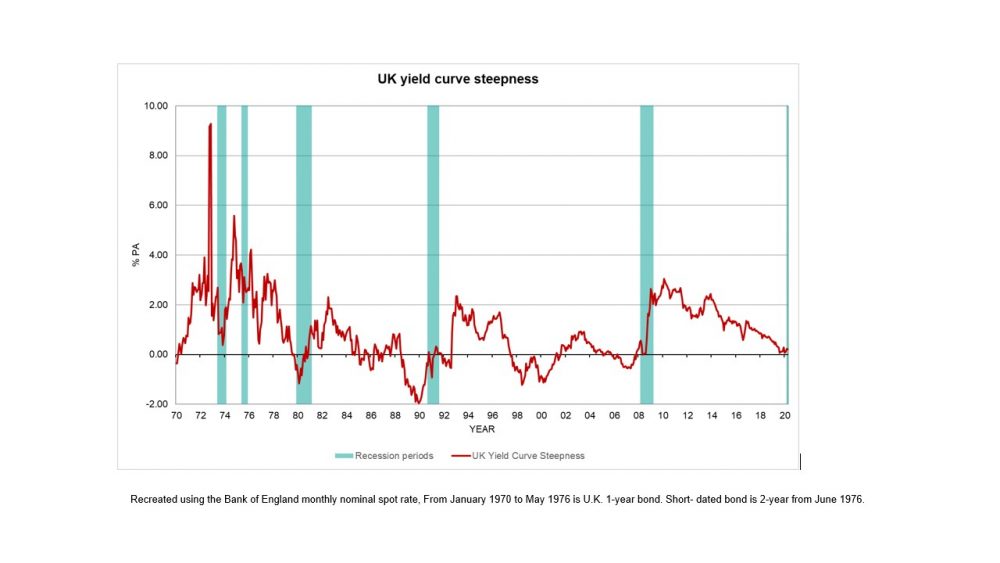
Both charts show that inverted yield curves can be an important metric when predicting future economic weakness. However the charts also show that the steepness often increases after recessions and that the variable levels over different recessions suggest that other factors might also be relevant. For example in the UK, the large amounts of quantitative easing over the past have resulted in the Bank of England owning a major share of gilts. This makes it more difficult to rely on yield inversions as predictors of a looming recession.

Predicting the future?
The past does not always predict the future and hence inverted yield curves should be used with caution when predicting a future recession. Other factors of supply and demand in the debt instrument market may also need to be considered when deducing the reason behind an inversion. For example there may be demand from pension schemes for long dated bonds to match their liabilities or Governments may use monetary policy to stimulate the economy.
In the UK, there have been times in the 2000s when there was an inversion, but a recession did not occur, and the economy remained strong. Moreover, the timing between an inversion and a recession is highly uncertain with it varying a lot in the past and this increases the difficulty of using inversions to predict future recession.
Recently, UK gilts saw an inversion during summer 2019 and this may potentially be another prediction of a recession. There are now many signs and reports that the UK is on the verge of a severe recession. However, the current economic situation is being heavily influenced by COVID-19 so these are unusual times when previous indicators may prove less reliable.
For further detail and expertise from GAD, see our Market data insights. The opinions in this blog post are not intended to provide specific advice. For our full disclaimer, please see the About this blog page.
Recent Comments